Arlington 2050 - Survey Data Analysis
October, 2024
This year, I taught a class about databases and data analysis for the first time. In my search for project opportunities, I learned about a project called Arlington 2050, "a year-long effort to engage neighbors across Arlington on what the County should look like by the year 2050."
This project largely relied on surveys for data collection. The survey team went to public places and events where they asked people to fill out "postcards from the future." The team collected about 1300 of these postcards and wanted help figuring out how to make sense of them. (Their full final report is available here). The team shared an early cut of the data with us, on the condition that we not share it, post it anywhere, or feed it into any online LLM (I'm intentionally not including many visualizations here out of respect for that request. I'll come back here to add more of our outputs once the data is released).
I workshopped this plan with a few colleagues, and we concluded that this was a great opportunity for my students. They got to explore Natural Language Processing ("NLP"), while connecting with their local community. This is a topic that I don't have a lot of experience in, so it also gave the students a chance to do their own research and "be the expert."
This blog post is a narrative reflection on the entire project. It is not a technical guide, but I've tried to link to technical documentation as much as possible. Feel free to reach out to me with technical questions!
If you're interested in exploring the Python code, check out some of my students' final Jupyter notebooks here:
Step 1 - Whalesongs
To motivate our study of NLP techniques, we listened to Two Heartbeats A Minute, an NPR Invisibilia podcast from 2020 about a nonprofit that is using NLP techniques to decode whale speech. This is a fascinating story, and includes a great lay-explanation of vector embeddings, a technique that we would use heavily in our project. There are so many other fun details in the podcast, so I highly recommend it. After the podcast, we had a great class discussion about vector embeddings and their applications. We also watched this video from Vox, which includes some nice visualizations starting around timestamp 5:20.
Step 2 - Exploring The Data
The "postcards from the future" were collected at a variety of community events (farmers' markets, cultural festivals, the county fair), locations (libraries), and online. Almost all were hand-written, and thankfully the county transcribed them before they got to us. We started with a table that contained a few text columns, along with some columns that described where the postcard came from. There were two prompts on the postcard, which said: "Share your message from the future here!" and "Getting here wasn't easy, but it was worth it! Here is how we did it".
Unsurprisingly, the responses included anything and everything (the county plans to release the data soon, I'll link it here if they do). Most cards were very thoughtful, but there were a few things we needed to handle thoughtfully:
- People were encouraged to write in whichever language they felt most comfortable. The county provided the original comment, as well as an english translation in a separate column
- Lots of spelling errors
- Some people misunderstood the prompts. Eg for the second prompt, a lot of people wrote something like "I rode the bus here to the library today"
- Some totally unrelated responses (including a few where the text transcription just said something like "a drawing of a dinosaur")
Step 3: Analyzing the data
At this point, I provided the general strategy for how we would approach this project. Our goal was to do a bunch of quick exploration, and then to identify "clusters" of comments related to popular topics. We broke the project down into a set of steps, and each student was responsible for one step. Each student researched their assigned topic, gave the class a mini lesson on the theory, selected which Python packages to use, and provided starter code.
The data was divided into several different files based on their source (one file for cards collected at the county fair, one for cards from the library, etc), and each file had slight differences in format. Each student in my class was responsible for the end-to-end process for one of the files, but we tried to keep our code and process similar, including a common schema so that I could collect all the data for a wholistic analysis.
Step 3.1: Data Cleaning
We used Pandas to ingest the data from excel. From there, we standardized the column names, and concatenated all of the text into a single field (after skimming the responses, we didn't feel that keeping the two questions on the cards separate was important). When the response was originally in another language, we kept only the english translation.
Next, we split the data into sentences. We found that many responses included a lot of different ideas, so we thought that sentences was a good way to separate out the ideas (eg. my own response had one sentence about bike lanes and another about third spaces for families with young children). After this step, we had one record per sentence instead of one record per response. We introduced a new ID that would help us find all the sentences that came from a single response.
Step 3.2: NLP Pre-processing
The goal of this step is to simplify the language and identify only the most meaningful words in each response. For more about the theory behind this step, see my student Jack's notes here. Here's a quote from those notes:
Lemmatization is the process of returning a word to its root form. For example, "running", "ran", and "runs" would all be converted into "run".
We used spaCy and pyspellchecker to pre-process the text. We broke the text into tokens, removed stop words and punctuation, passed each token through pyspellchecker, and then Spacy's lemmatizer.
There were a few gotchas with this process. First, there were a lot of words
that pyspellchecker didn't recognize (including "Arlington"). pyspellchecker's
default behavior is to return None for any word it doesn't recognize. That's
probably reasonable behavior (because any word that the spell checker doesn't
recognize would probably also not be recognized by any of our downstream tools),
but we wanted to preserve them. We ended up adding this code:
corrected_word = spell.correction(token.text)

if corrected_word is None:
    corrected_word = token.text
Step 3.3: Sentiment Analysis
A lot of words have sentiment baked into their meaning (eg "happy" has a strong positive sentiment, "nasty" has a strong negative sentiment) For more about the theory behind this step, see my student Miguel's notes here.
spacytextblob is a Python package that assigns a polarity (positive/negative score) and subjectivity to every word. By averaging the scores of all the words in a sentence, we can come up with an overall score for the whole sentence. We spent some time building histograms and comparing to see whether there were any major differences in polarity between different subsets of the data.
Step 3.4: Vector Embeddings
This is a cool technique where each word can be represented as a point in some
high-dimensional space. From there, we can do standard math on those points that
corresponds well with the words' meanings. For one classic example: in this vector
representation, we can make equations like: king - man + woman = queen.
For more about the theory behind this step, see my student Blu's notes
here
or checkout the podcast episode and youtube video that I mentioned above.
We used spaCy's en_core_web_md model for this step (we chose this 'medium' model because we were constrained by our school-issued laptops, and the small model doesn't include vectors).
For each sentence, we
found the vector embedding for each word, and then computed the mean of all the
vectors.
The output was a new dataframe that included 300 columns for each sentence.
My student Blu is currently working on an independent project about storing this kind of data in a dedicated vector database, Weaviate - maybe we'll make a follow-up post about that work someday.
Step 3.4.1: A Tangent on Semantic Search
Once we had vector embeddings, we explored the concept of semantic search. We spent some time typing in queries (like "bike lanes" or "diversity") and found comments that were semantically closest to our queries. If you're interested in this idea, I highly recommend playing with https://semantle.com/, a word guessing game that works similar to Wordle but is based on semantic similarity instead of spelling.
Step 3.5: Dimensionality Reduction
300 dimensions was way too many for our purposes. We needed to project these vectors into a lower-dimensional space before clustering/visualizing. For more about the theory behind this step, see my student Alex's notes here. And for a better discussion of why clustering works better after dimensionality reduction, see this Wikipedia page: curse of dimensionality
We used scikit-learn's principal component analysis function, used NumPy to calculate explained variance from each component, and PyPlot to graph CDF elbow curves.
We spent a lot of time playing with this step and tweaking the parameters to determine how many components to keep.
Step 3.6: Clustering
Finally, we wanted to find groups of comments that expressed similar themes. For more about the theory behind this step, see my student Lehiem's notes here
After a bit of dimensionality reduction, we clustered using scikit-learn's KMeans.
Again, we tweaked with the parameters a bit. We used the sum of squared errors as a metric to evaluate our clusters. We generated elbow plots to target a reasonably-small number of clusters that would minimize the sum of squared errors.
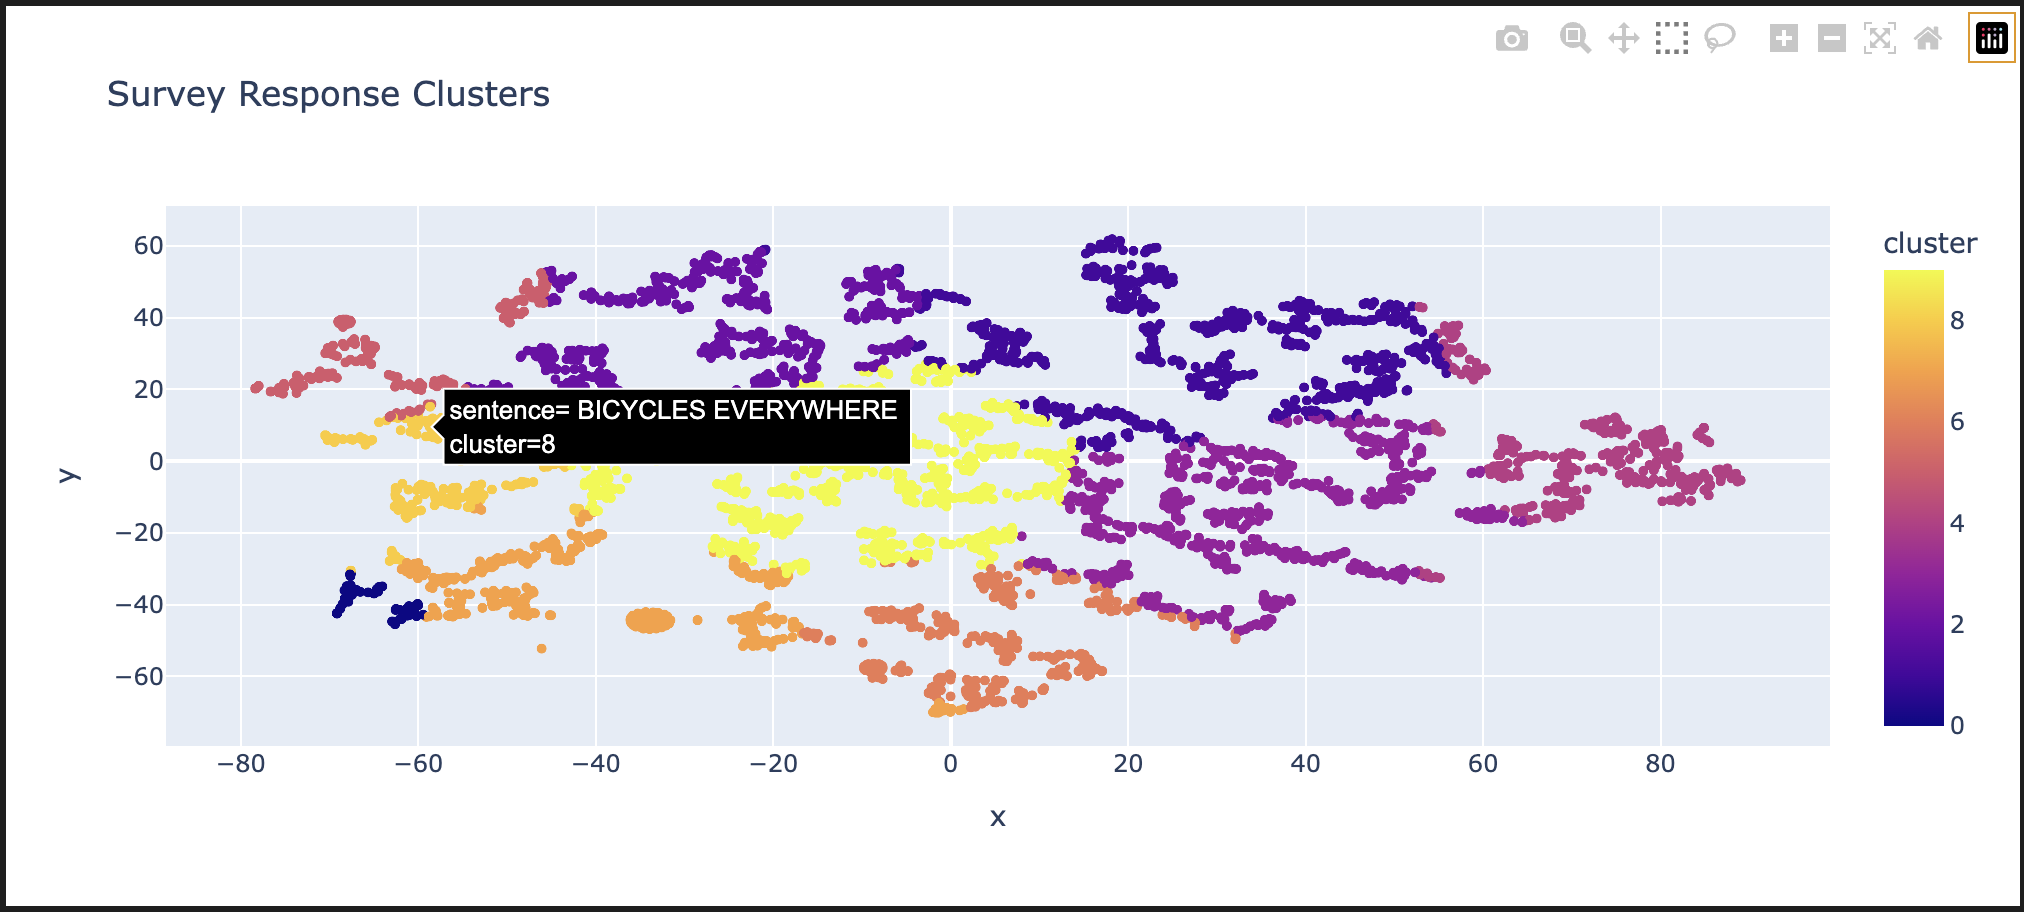
Step 3.7: Visualization
Finally, we wanted to visualize our outputs. We used scikit-learn's TSNE to reduce our final points to two dimensions (we chose this algorithm over PCA because it preserves clusters).
Then we used Plotly Express to generate a nice, interactive visualization. One output from this step is shown at the top of this page - users can over over individual comments to read them (I'm a bit biased in the comment that I chose to highlight for this screenshot).
We also used scikit-learn's euclidian distance function to find and display a few comments that are closest to the centroid of each cluster.
Step 4: Analysis, Takeaways, Reflection
While we didn't extract groundbreaking insights for the County, the learning outcomes for students were profound. As the old proverb goes, the journey here was worth a lot more than the destination. We spent a lot of time tweaking parameters, playing with segmentations, and looking for co-ocurrences, but did not come away with any exciting insights that would help the 2050 project.
I think there are a few reasons for this outcome. First, the sample size was not huge - we had about 1300 survey responses for a county of about 250000 people. For context, one recommendation (from the slides that I linked in section 5) recommend that "It requires a minimum of 3,000 previously coded comments, and categories with at least 100-200 examples." Second, I came away with the conclusion that Arlingtonians (or, at least, the kind of Arlingtonians who engage with this kind of survey) have a fairly consistent viewpoint - this project might have gone differently if the responses were more diverse.
If we had more time, I really think that the supervised learning approach would have been helpful - I'd love to revisit that part.
But I think the takeaways for my students went far beyond the conclusions of this exercise. Students really seemed to enjoy the project and took pride in being "the class expert" on their chosen strategy and chosen dataset.
I also enjoyed the opportunity to expose my students to advanced math and stats concepts. Most of the math concepts that we used were new to my students, so we spent a lot of time whiteboarding about the fundamentals (questions like "what does a 300-dimension vector look like?", "What is a principal component?", "What is a Bayesian Inference?"). We specifically focused on how to use each of the techniques, and I encouraged my students to not get too bogged down in the math. They seemed excited to take the proper math classes in the future. I know that I was not excited about linear algebra the first time that I studied it because I had trouble connecting it to anything applied. I hope that this project primed primed students to enjoy it more than I did.
We had the opportunity to connect with folks in county government and had great discussions about participatory democracy. For example, during one conversation, a student shared a word cloud they made with wordcloud. that showed us that one of the most popular phrases was "Missing Middle," which they did not recognize. The representative who was meeting with us explained that Missing Middle was a multi-year and hugely contentious zoning initiative that plans to increase residential density. This was one of the most hot-button issues in the upcoming county board election. One student responded that they had just turned 18, were about to vote for the first time, and appreciated the insight.
Step 5: Future Work
Supervised Learning
Everything we've described so far is considered unsupervised learning - we started with a dataset of completely new information and used clustering to find patterns. We also wanted to see how supervised learning (having a human provide some extra input) might help this project.
I worked with a separate student on this project to explore a supervised learning path as an independent study. That student and I attended a workshop at Univeristy of Maryland called Bridging Natural Language Processing (NLP) and Survey Research at SurvAI-Day, where we saw presentations from Tyler Waite of IBM about Naive Bayes classification in Python, and from David Jurgens from University of Michigan about using Python for manual text annotation.
We were very excited about this potential, but it would have required a first pass manually annotating some data. We stood up an instance of Jurgens's text annotation tool, Potato, loaded all of the data, and worked with our contacts at Arlington County to iterate on a "code book" of tags to use in the annotation effort. Unfortunately, we did not have the time or funding to complete much manual tagging, so this effort fizzled out. If/When Arlington releases the data, we would love to revisit this strategy.
Co-occurrences
Our contact at Arlington County shared this cool article about co-occurrance analysis. We experimented with a few approaches, including the clusters we created, n-grams, etc. We hoped to find some interesting relationships with this technique (For example, that people who used the phrase "bike lane" also were more likely to use the phrase "green space"). We did not get to anything especially exciting with this strategy, but we would love to revisit with human-categorized topics.
LLMs
A lot of our ideas involved feeding the data into an LLM. There were (very valid) privacy concerns about using any online LLM, and we didn't have a powerful-enough machine locally.
Other Algorithms
For each of the steps described here, there is a wide menu of algorithms to choose from. I did a bit of exploration on my own, including the BART Model for embeddings. One limitation of spaCy's embeddings is that they consider each word independently and completely ignores context (we call this a "bag of words approach") - BART is an alternative that does take context into account, and DBSCAN which might have given better clustering results by excluding outliers. I chose to leave these out of our class project in favor of simpler algorithms.
Step 7: Thanks!
Huge thank you to everyone who supported me and my students in this effort. Kristen Clark and David Barrera from Arlington County were very supportive in answering our questions. The administration at our school sponsored our trip to the AI summit, lots of folks there were excited to share advice to a high school teacher and student, and a colleagues at my school (including Jeff Elkner and Gerri Maskeloni) provided helpful guidance and technical advice. Finally (and most importantly) thank you to my students for the enthusiasm throughout this project - you all did great!